Milcah- Mulea

Hi there! I’m Milcah, a data analyst with a keen eye for uncovering insights hidden within datasets. I empower companies and researchers across industries to leverage the power of data. My expertise lies in wrangling, cleaning, and analyzing complex data, ensuring it’s ready to be transformed into actionable knowledge.

I don’t just crunch numbers, I translate them into clear and concise narratives, helping you make data-driven decisions that drive real results.

Education Background

My academic journey began with a Bachelor’s in Purchasing and Supplies Management at Meru University of Science and Technology, Kenya. This program instilled a strong understanding of supply chain intricacies, fostering a passion for efficiency and strategic decision-making. However, my curiosity extends beyond traditional supply chain management. The power of data analysis to unlock hidden insights and transform decision-making processes profoundly fascinates me.
This passion fueled my exploration of online courses, particularly DataCamp’s Data Analyst track. Here, I’m actively acquiring the fundamentals of data analysis, equipping myself with the tools to extract valuable knowledge from complex datasets. My commitment to learning doesn’t end with formal education. I believe in independent exploration and collaboration, constantly seeking new knowledge from colleagues, tackling personal data projects, and staying updated on the field’s advancements. This confluence of my supply chain background and growing data analysis expertise excites me. I envision leveraging this unique combination to optimize decision-making processes, improve organizational efficiency, and unlock new avenues for success.
Timeline

Bachelors Degree

2019

Procurement

2020-

Data Analyst

2020

Data Visualization

2021

The Services I offer

Data Analysis Services

Data Collection and Extraction

I gather and extract relevant data from various sources, ensuring a solid foundation for analysis.

Data Cleaning and Preparation

I meticulously clean and prepare data to eliminate inaccuracies and ensure high-quality datasets for further processing.

Data Mining and Analytics

Using advanced techniques, I uncover patterns and insights from large datasets to inform strategic decision-making.

databases-and-servers/databases/data-modellingCreated with Sketch.

Predictive Modeling

I build and validate predictive models to forecast trends and behaviors, enabling proactive business strategies.

Visualization and Dashboards

I create intuitive data visualizations and interactive dashboards that present data in a clear and accessible manner.

Data Storytelling

I craft compelling narratives around data insights, making complex information engaging and understandable for stakeholders.

Content Creation and Marketing

Blog Writing and SEO

I create compelling blog posts and articles that are optimized for search engines, ensuring your content ranks high in search results and attracts organic traffic.

Email Marketing

I develop targeted email campaigns to effectively communicate with your audience, promote your products or services, and nurture customer relationships.

Technical Writing

With a focus on clarity and precision, I produce technical documents, manuals, and guides that make complex information easily understandable for your audience

My Portfolio

The tools I use...

Hover Effect Table
Excel Power BI Tableau Python SQL
Image
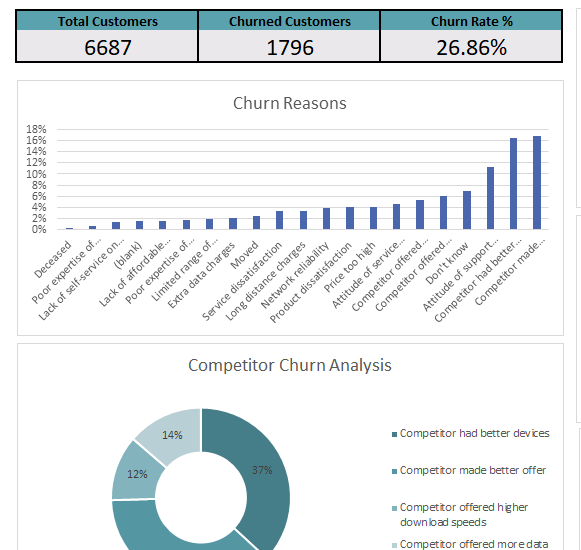
Identifying Customer Loss Triggers I tackled customer churn for a company using Excel's analytical power. By calculating churn rates and leveraging pivot tables, I identified factors associated with customer departures. The analysis revealed patterns in demographics, purchase history, or service interactions that might predict churn. These insights empower the company to develop targeted strategies to retain valuable customers and minimize churn. #churnanalysis #excel #datadriven
Image
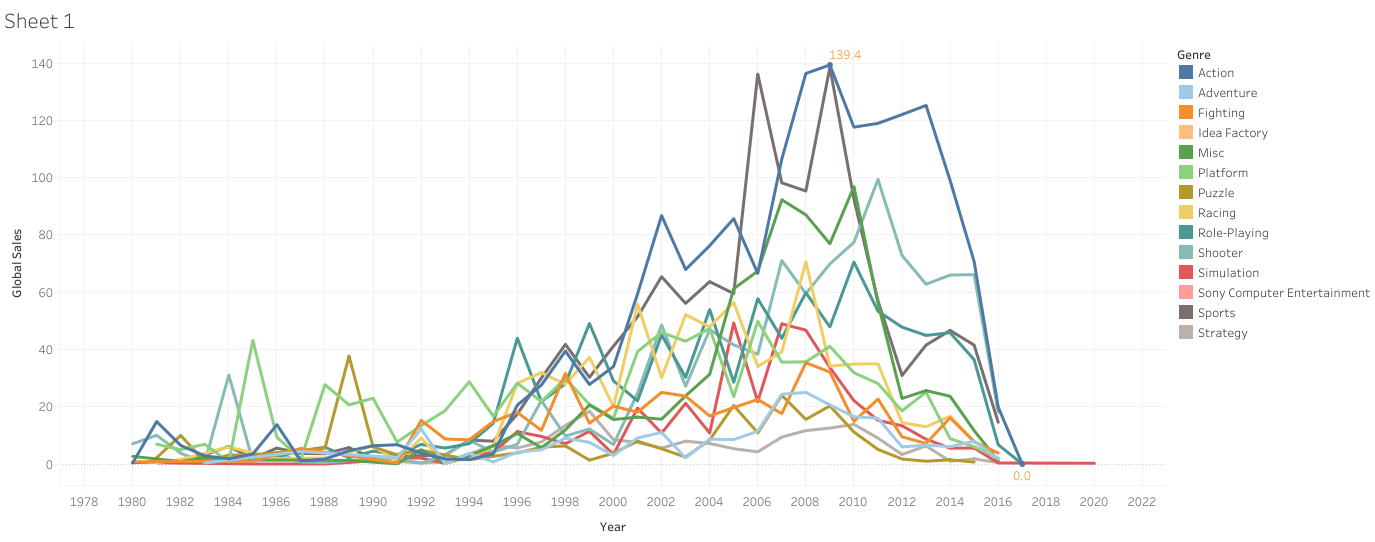
I transformed sales data into actionable insights using Tableau's data visualization magic. This deep dive uncovered hidden patterns in product performance, regional trends, and customer behavior. With these insights, the sales team can now optimize strategies, target high-potential areas, and ultimately drive revenue growth. #dataanalysis #tableau
Image
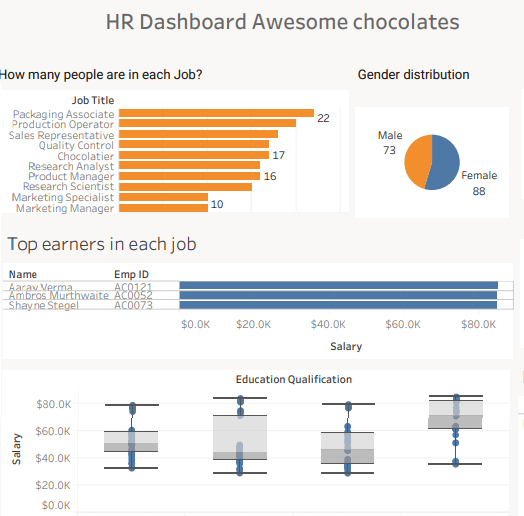
To gain insights into our workforce, I conducted a Tableau-based analysis. By examining age, gender, education, salary, and tenure, we aimed to identify patterns and trends. Data was meticulously cleaned and prepared before being visualized using interactive dashboards. These visual representations revealed age distribution, gender balance, educational levels, salary disparities, and tenure patterns. The findings informed strategic HR decisions, such as talent management, compensation strategies, and diversity initiatives. Ultimately, this project empowered stakeholders with data-driven insights to optimize workforce performance. #dashboards #excel #datadriven

CONTACT

Feel free to contact me with any questions or inquiries. You can reach me via email or WhatsApp for a quick response. Additionally, we can connect and engage on social media platforms like Twitter (X) and Reddit. I’m always open to new connections and discussions.